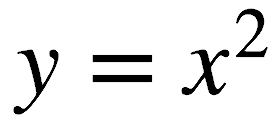
The SAT is pretty fond of parabolas. I mean, who wouldn’t be—they’re beautiful! Parabolas are generated from the graphing of quadratic equations. Parabolas have symmetry around a vertical access. Parabolas can open upward or downward, depending upon whether the x-squared term is multiplied by a positive number. Here’s the most basic parabola—

In this example, the graphed parabola would open upward, as the x-squared term is multiplied, in essence, by a positive number (i.e., positive 1). Parabolas have either a minimum (for upward opening parabolas) or a maximum value (for downward opening parabolas). The standard form for quadratics is—

Quadratic Equation DEFINITION—an equation containing a single variable of degree 2. Its general form is ax2 + bx + c = 0, where x is the variable and a, b, and c are constants (a ≠ 0). Recall that that’s the form you must use in order to plug the constants (a, b and c) into the Quadratic Equation.

The vertex is the point of the graph that lies on its axis of symmetry. In the case of parabolas, the VERTEX is the maximum (or highest point on the graph) for parabolas that point downward, and it’s the minimum value (or lowest point) for parabolas that point upward. The vertex is also the point at which the graph changes direction.
OK, and now it’s time for my pitch!! Are you really going endlessly read through hundreds of pages of text to master all of these concepts AND then doggedly practice these concepts within the unique context of the SAT?? OR . . . would you rather engage in our cutting curriculum of INTERACTIVE VIDEO??!! I think we both know the answer!

