Linear equations are frequently depicted as graphs on the SAT MATH exam. And of course there are two critical components of any graph of a linear equation—
- SLOPE (change in y divided by change in x)
- y-intercept (where the line crosses the y-axis)

A graph that shows a steep upwards line (as you move across the graph from left to right) means that y is increasing rapidly as x increases. As an example, let’s say that the x-axis represents hours and the y-axis represents miles. And let’s say that two lines are shown; one that’s rising steeply and one that’s rising slowly. So we can, for instance, measure the slope of each graphed linear equation and compare. And what are we comparing? Remember that slope corresponds to RATE of CHANGE. In this specific example, the slope represents a velocity (i.e., MILES per HOUR). So the two graphs could represent two drones, for instance, both moving in a positive direction, but one flying slowly and one flying much more quickly.
How fast is each drone moving? Well, let’s start with the steeper graph. I’ve placed two convenient points (always try and pick points that reside on an intersection of the graph grid). So we see that over a period of two positive hours (from x = 1 to x = 3), that y (i.e., miles) increases by how much?? Here you must exercise a little more care. Each hashmark on the y-axis represents 15 miles, right?? So in 2 hours the faster drone flies 90 miles (i.e., 135 minus 45). OK, so the faster drone’s speed is 45 MPH (in other words, 90 divided by 2)!
Next let’s determine the slower drone’s speed. When HOURS change from zero to three, miles increases by 30 (from 105 to 135; again be careful with properly interpreting the calibration of the y-axis). So the slower drone flies at only 10 MPH. So it stands to reason that at some point the faster drone will be looking in its rear-view camera(!) at the slower drone.
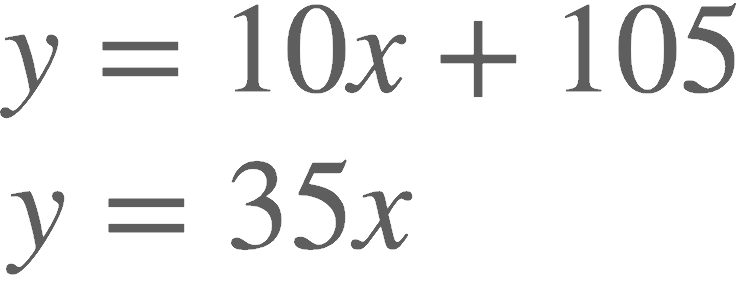
And now how about the y-intercept? We see that one graph “passes through the origin” (and yes, you will see that phrase on your exam) and the other has a y-intercept of plus 105. So this means that the slower drone received a 105-mile head start. But nonetheless, as mentioned above, the faster drone will eventually draw even and then pull away, given its 35-MPH speed advantage. So . . . at what point are the drones momentarily neck-and-neck? That’s the point at which the the two lines cross, and that point represents the “solution” to the system of equations which the two lines create (in other words, the point of intersection is the only point whose x- and y-value satisfies both equations). So reading that point from the graph we see that the lines intersect at the 3-hour mark. Does that make sense? Well, let’s inspect the linear equations that the two lines represent—

The first equation represents the slower drone traveling at 10 MPH but with 105 head start. The second equation represents the faster drone flying at 35 MPH, but taking off from the starting line.
If you substitute 3 for x in both of the above equations, you’ll find that y equals 180 for both equations. Therefore, after three hours both drones have reached the 180-mile mark, the faster drone starting from the zero point, and the slower drone starting from the 105-mile mark. So everything checks out!

As described above, the SAT test-makers may ask you which graph represents a given linear equation. That’s pretty easy IF the equation is given in the slope-intercept form. However, check out a sample linear equation that you’re more likely to see—

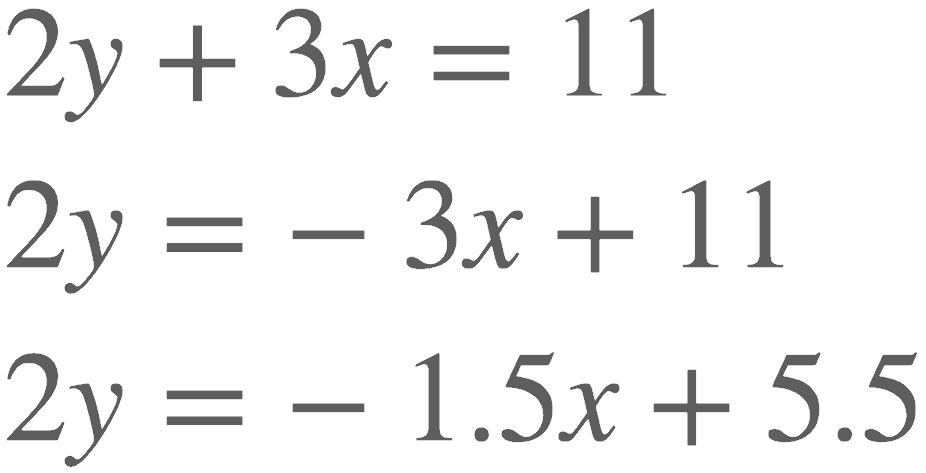
What would this graph look like? Could you immediately choose from four graphed answer choices? Suddenly, both the slope and the y-intercept are not at all apparent (and beware of jumping to the conclusion that the y-intercept is 11; cuz it’s not!). But of course, we can perform some basic algebra and transform the above equation into something much more useful (i.e., the slope y-intercept form!).

So is the slope of the above equation going to be positive or negative? After subtracting 3x from both sides of the equation and then dividing by 2, we see that the slope is negative 1.5 and the y-intercept is positive 5.5. So the graphed line of this equation points downward, as y decreases by 1.5 units for every one unit positive change in x.
And by the way, if this graph were yet another drone, but the x– and y-axes were miles and minutes, what phenomenon would be depicted here?? This would represent a drone with a head start of 5.5 miles, BUT flying backwards at 1.5 miles per minute! Now, if you review our Units of Measurement module, you’ll easily convert this to a blistering 90 miles per hour!! But in the opposite direction of our two original drone racers!
And another BTW— the SAT test-makers will also ask you to determine a linear equation without any graph being displayed. In this scenario, they’ll either give you two points on the graph (such as (1, 4) and (3, 1) as displayed above OR they’ll supply you with a slope and a single point (this being is the easier scenario). Bottomline—calculate the slope (if necessary) and then plug in a point to solve for the y-intercept.
Graphing problems on the SAT MATH exam also can involve—
- Parallel lines (same slope / different y-intercepts)
- Perpendicular lines (slopes are negative reciprocals of one another)
- Identical lines (with the two equations disguised algebraically), etc.
And then of course, there is the graphing of quadratic equations (which feature the determination of the ROOTS, MINIMUM and MAXIMUM values, and the VERTEX, etc.). And finally, the graphing of higher-order polynomials (with their turning points, direction of the “legs” of the graph, etc., etc.). This, in and of itself, is another major area of study.
So . . . our recommendation is— try a FREE 24-hour pass and see if you agree that our INTERACTIVE VIDEO approach is absolutely the best way to master all of the MATH (including every graphing permutation that you’re likely to encounter on the exam)!

